top of page

Research Blog

Buscar

During the last decade, radio detecting and ranging (RADAR) technology evolved from the linear-frequency-modulated (LFM) systems developed in the 1970s to the orthogonal frequency-division multiplexing (OFDM) systems developed in the early 2000s. In the mid-2010s, systems were proposed that combined the radar principle with optical solutions developed for imaging and ranging tasks following a hyperspectral embedded systems approach. The idea was to profit on the one side from the possibility offered by RADAR systems to work in harsh environments using emitted radio waves and detect mainly metal objects placed far away (hundreds of meters or even kilometers) from the detection system with positioning spatial resolutions in tens of centimeters, even if there are non-metallic barriers such as, e.g., walls in between, and expand this possibility by using optical systems (e.g., light detecting and ranging –LIDAR- systems), using visible light active illumination, capable of generating 2D and 3D images of objects placed at much smaller distances from the detector, but allowing for much higher spatial resolutions (in the millimeter range). To reduce the atmospheric absorption of the emitted active illumination and increase the emitted optical power allowed for these systems that can correctly function even in harsh environments, we propose shifting the active illumination wavelengths from the visible range to the near infra-red (NIR) range, e.g., to 1550 nm. Lacking affordable image sensors fabricated in InGaAs technology, capable of detecting NIR radiation, in this work, we propose a hyperspectral imaging system using a very low power consuming single commercially available InGaAs photodiode to generate 2D images using the single-pixel imaging (SPI) approach based on compressive sensing (CS) and an array of NIR light emitting LEDs, combined with an 80 GHz millimeter band RADAR. The system is conceived to deliver a maximum radar range of 150 m with a maximum spatial resolution of ≤ 5 cm and a RADAR cross-section (RCS) of 10 – 50 m2, combined with an optical system capable of generating 24 fps video streams based on SPI generated images yielding a maximum ranging depth of 10 m with a spatial resolution of < 1 cm. The proposed system will be used in unmanned ground vehicle (UGV) applications enabling decision-making in continuous time. The power consumption, dimensions, and weight of the hyperspectral ranging system will be adjusted to the UGV-targeted applications.


RADAR SYSTEM


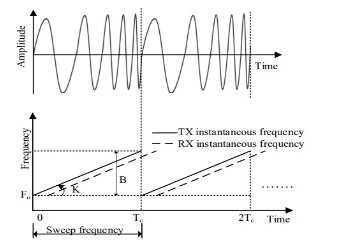
Due to the advantages offered by orthogonal frequency-division multiplexing (OFDM) radars in terms of bandwidth, controlled in these systems using multiple carriers, and in terms of ambiguity over LFM modulation, we propose using an OFDM radar imaging system with an operating frequency of 2.8 GHz together with the Software Defined Radios (SDR) tool, ETTUS B200 modules, and an antenna array. The proposed radar system was implemented and was finally tested on a UGV following the configuration. The scene scan is performed in front of the vehicle during the driving process. The RADAR imaging information is obtained from the radio signals reflected from the (primarily metallic) surrounding objects. Using the gathered information, a 2D image is generated, on the one hand, along the x-axis following a “cross-range” mode, following Eq. (1), where dmax is the distance to the object,  the emitted radiation wavelength, and Leff the effective length of the antenna used for the emitter. On the other hand, the “down-range” is generated along the y-axis, defined using Eq. (2), where c is the speed of light, Nf is the frequency number, and Δf is the subcarrier spacing.


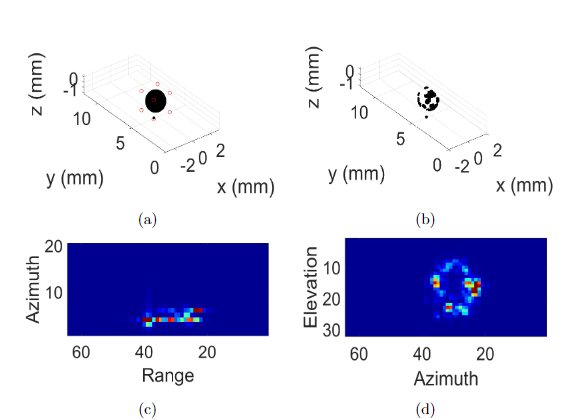
Fig.1. Photographs obtained from two test scenarios created for the performance evaluation of the OFDM RADAR system placed on top of a UGV (shown on both pictures on the left): (a) in the first test scenario, a cylindrical metallic object was placed at a distance of 90 cm in front of the UGV, which was then properly imaged by the RADAR, as it can be shown on the graph on the right; (b) in the second test-scenario, two objects to the one used in (a) were placed at precisely the same spot but 15 cm apart from each other, and were once again imaged adequately by the system, as shown on the graph on the right.


Foto del escritorCarlos Osorio

Single image super-resolution (SR) methods aim at recovering high-resolution (HR) images from given low-resolution (LR) ones. SR Algorithms are mostly learning-based methods that learn a mapping between the LR and HR image spaces (see Fig.1) . Among SR methods present in the literature, there are Super-Resolution Convolutional Neural Networks and Fast Super-Resolution Convolutional Neural Networks, among the most used ones.


Fig.1. Comparative performance of the SRCNN and FSRCNN super-resolution method.


FSRCNN: A improvement of the SRCNN method, which adopts the original low-resolution image as input. This method is divided into five parts:

  • Feature Extraction: Bicubic interpolation in previous SRCNN is replaced by 5×5 conv.

  • Shrinking: 1×1 conv is done to reduce the number of feature maps from d to s where s<<d.

  • Non-Linear Mapping: Multiple 3×3 layers are to replace a single wide one

  • Expanding: 1×1 conv is done to increase the number of feature maps from s to d

  • Deconvolution: 9×9 filters are used to reconstruct the HR image.


The FSRCNN is different from SRCNN mainly in three aspects. First, FSRCNN adopts the original low-resolution image as input without bicubic interpolation. A deconvolution layer is introduced at the end of the network to perform upsampling. Second, the non-linear mapping step in SRCNN is replaced by three steps in FSRCNN: the shrinking, the mapping, and the expanding step. Third, FSRCNN adopts smaller filter sizes and a deeper network structure. These improvements provide FSRCNN with better performance but lower computational cost than SRCNN.

Fig.2. Network structures of the SRCNN and FSRCNN methods.


Structure of FSRCNN

For the implementation of the FSRCNN, we implemented a model with eight layers, where layer 1 is the Feature extraction, layer 2 is, layers 3–6 are denoted to figure 3, layer seven carrier out expanding, and layer 8 performs the deconvolution function. The layers are defined as follows:


  • Conv. Layer 1 "Feature extraction": 56 filters of size 1 x 5 x 5.Activation function: PReLU. Output: 56 feature maps; parameters: 1 x 5 x 5 x 56 = 1400 weights and 56 biases

  • Conv. Layer 2 "Shrinking": 12 filters of size 56 x 1 x 1. Activation function: PReLU. Output: 12 feature maps; parameters: 56 x 1 x 1 x 12 = 672 weights and 12 biases

  • Conv. Layers 3–6 "Mapping": 4 x 12 filters of size 12 x 3 x 3. Activation function: PReLU. Output: HR feature maps; parameters: 4 x 12 x 3 x 3 x 12 = 5184 weights and 48 biases

  • Conv. Layer 7 "Expanding": 56 filters of size 12 x 1 x 1. Activation function: PReLU.Output: 12 feature maps; parameters: 12 x 1 x 1 x 56 = 672 weights and 56 biases

  • DeConv Layer 8 "Deconvolution": One filter of size 56 x 9 x 9. Activation function: PReLU. Output: 12 feature maps; parameters: 56 x 9 x 9 x 1 = 4536 weights and 1 bias


Fig.3.Structure of FSRCNN.


Fig.4: SPI 2D image reconstruction using Batch-OMP algorithm in combination with FSRCNN for the scanning methods: Basic, Hilbert, Zig-Zag, and Spiral. As the test object, a Sphere with 50 mm of diameter placed at 25 cm focal length:(a-d)SPI reconstruction of the 8x8 image using the following scanning methods Basic, Hilbert, Zig-Zag, and Spiral respectively, (e-h) post-processing a method based on the application of a bilateral filter, and(i-l)SPI image obtained after applying the FSRCNN approach.


Foto del escritorCarlos Osorio

Single image processing time is critical for generating 2D digital images and video streams in SPI for real-time applications. To reduce the time required by the 2D image processing system, to generate an image, we determined the minimum number of illumination patterns equivalent to a compression factor of 2% to be able to adapt the OMP-Batch Algorithm [68] based on hardware architecture and a GPU. The OMP-Batch Algorithm [68], compared with other compressed sensings (CS) Algorithms such as OMP and OMP-Cholesky, presents improvements in processing time because they do not make operations of the inverse matrix. On the contrary, using the definition of the Gram-matrix, G=ATA, initially, pre-calculating Gram-matrix G with initial projection i, where an initial projection as p0=ATy is defined. This allows finding the new atom Ai, which will be used as stop criteria for the system solution calculation. For implementing the OMP-Batch algorithm, we defined four kernels that must operate in parallel.


  • The input information is defined in the first kernel, the Gram-matrix (G= ATA) is generated, and the residual norm r is calculated.

  • The second kernel was used to calculate the new atom Ai.

  • The third kernel was used to calculate the Cholesky decomposition, where the matrix N×N was defined to calculate the matrix L using.

  • The fourth kernel was used to calculate the matrix space-vector product and the normal error e.

Implementation of the OMP-Batch algorithm on GPU


For the implementation of the OMP-Batch algorithm on GPU, we must take into consideration some details, such as: The Cholesky factorization scheme, the memory layout, the matrix batched-matrix products, normalized columns of the dictionary, packed representation (library Python), and efficient batched argmax


Memory layout: The main bottleneck in the process is matrix multiplication. To get more speed, transpose the matrix columns, as one column can span into a single line in the memory. After that, we apply the operation of matrix multiplication.


Cholesky factorization scheme: The OMP-Batch uses an inverse Cholesky factorization method based on the precomputedATy, and ATA, in the parallel computing environment. We seek to calculate Lk, which we do not need to store in each iteration. We only need to perform are iteration

to obtain the new projections w.


Matrix batched-matrix products: A less-known fact is that we can sometimes get higher performance. If we apply the matrix times batched-matrix product. We can see that this matrix times batched-

vector product is equivalent to a simple matrix-matrix product, with which we can use the library BLAS (Basic Linear Algebra Subprograms) most efficiently.


Normalized columns of the used dictionary: The main approach to speeding up the algorithm is to minimize the number of operations to perform each iteration. Many algorithms assume normalized columns in A such that correlation projection⟨an, rk−1⟩/∥an∥ turns into a simple projection ⟨an, rk−1⟩=[ATrk−1]. This is valid since the algorithm is invariant to the column norm, as it will be divided out in the correlation step, and lastly, the least-squares estimateˆyk=AAT y=A,argminx∈Rk∥y−Ax∥ is unique. Thus, it is also invariant to column scaling. For the final estimate ˆx from ATAˆx=ATy, one should not use the pre-normalized A, or at least the scale ˆxappropriately (by the reciprocal of the column norm) to account for this.


Packed representation: Specialized calls for batched matrix-matrix multiplication, batched Cholesky factorization and batched triangular system solving for GPU exist. In our approach, we use the PyTorch library.


Efficient batched argmax: A core part of the OMP loop is argmax, which can be performed on a batch by k= arg maxK|p|. One issue is that abs (|p|) creates an intermediate M×N array in the first pass, and then a second pass over this is needed to get the ”argmax.” The ”argmax” line takes 5-25% of the

GPU computation time. To optimize this, we applied libraries of CuPy to increase the speed-up of computation. The function arg maxK is compiled in C++ and called in Python as an external function.


By implementing the OMP-Batch on GPU, we can reach an acceleration of x27 compared to running the same algorithm on the CPU (see Fig. 1). In table 1, we compared the complexity and memory requirements of the different OMP reconstruction test algorithms.


Table 1. Comparison of complexities and memory requirements in the k-th iteration,

where the dictionary Φ is MxN.


Fig.1.Comparative reconstruction time for running the OMP-Batch algorithm on different platforms: CPU Intel i5 OMP Basic, CPU-1 with Linux OMP basic, GPU-VO using Pytourch GPU reach an acceleration x 17 on Jetson Nano, GPU-V1 using PyTorch GPU compile in C++ the function arg maxK with an acceleration x 27 on Jetson Nano


bottom of page